Friday, March 31, 2017

Freemat Tutorial

 FreeMat v4.2
 Copyright (c) 2002-2008 by Samit Basu
 Licensed under the GNU Public License (GPL)
 Type <help license> to find out more
      <helpwin> for online help
      <pathtool> to set or change your path
 Use <dbauto on/off> to control stop-on-error behavior
 Use ctrl-b to stop execution of a function/script
 JIT is enabled by default - use jitcontrol to change it
 Use <rootpath gui> to set/change where the FreeMat toolbox is installed
--> Warning: unable to find function base to single step
--> Warning: Last warning repeats... suppressing more of these
--> loge(e)
Error: Undefined function or variable loge
--> e=
Error: Unexpected input

     e=
      ^
--> sprt(4)
Error: Undefined function or variable sprt
--> sqrt(67)
ans =
    8.1854
--> sqrt(4)
ans =
 2
--> ln(2)
Error: Undefined function or variable ln
--> log(2.71)
ans =
    0.9969
--> 2*sin(6.28)
ans =
   -0.0064
--> 3=4
Error: Unexpected input

     3=4
      ^
--> log(e)
ans =
 1
--> e=
Error: Unexpected input

     e=
      ^
--> e
ans =
    2.7183
--> e=1.1
e =
    1.1000
--> e
ans =
    1.1000
--> e
ans =
    1.1000
--> log(e)
ans =
    0.0953
--> e=2.7183
e =
    2.7183
--> pi
ans =
    3.1416
--> pi=3.3
pi =
    3.3000
--> pi
ans =
    3.3000
--> pi(3.1416)
Error: index is out of bounds
--> pi=3.1416
pi =
    3.1416
--> Sin(3.14)
Error: Undefined function or variable Sin
--> sin(3.14)
ans =
    0.0016
--> %Sin is now used for as variable.
--> C=[1,2,3;4,5,6;7,8,9]
C =
 1 2 3
 4 5 6
 7 8 9
-->
-->
--> C
ans =
 1 2 3
 4 5 6
 7 8 9
--> A=0:0.5:10
A =
 Columns 1 to 11
         0    0.5000    1.0000    1.5000    2.0000    2.5000    3.0000    3.5000    4.0000    4.5000    5.0000
 Columns 12 to 21
    5.5000    6.0000    6.5000    7.0000    7.5000    8.0000    8.5000    9.0000    9.5000   10.0000
--> A'
ans =
         0
    0.5000
    1.0000
    1.5000
    2.0000
    2.5000
    3.0000
    3.5000
    4.0000
    4.5000
    5.0000
    5.5000
    6.0000
    6.5000
    7.0000
    7.5000
    8.0000
    8.5000
    9.0000
    9.5000
   10.0000
--> test1=[2345]
test1 =
 2345
--> test1=[2,3,4,5]
test1 =
 2 3 4 5
--> test2=test1'
test2 =
 2
 3
 4
 5
--> C=
Error: Unexpected input

     C=
      ^
--> C
ans =
 1 2 3
 4 5 6
 7 8 9
--> C'
ans =
 1 4 7
 2 5 8
 3 6 9
--> A=0:1:12
A =
  0  1  2  3  4  5  6  7  8  9 10 11 12
--> B=e^A
Error: Power (^) operator can only be applied to scalar and square arguments.
--> B=sin(A)
B =
 Columns 1 to 11
         0    0.8415    0.9093    0.1411   -0.7568   -0.9589   -0.2794    0.6570    0.9894    0.4121   -0.5440
 Columns 12 to 13
   -1.0000   -0.5366
--> B=
Error: Unexpected input

     B=
      ^
--> B
ans =
 Columns 1 to 11
         0    0.8415    0.9093    0.1411   -0.7568   -0.9589   -0.2794    0.6570    0.9894    0.4121   -0.5440
 Columns 12 to 13
   -1.0000   -0.5366
--> B'
ans =
         0
    0.8415
    0.9093
    0.1411
   -0.7568
   -0.9589
   -0.2794
    0.6570
    0.9894
    0.4121
   -0.5440
   -1.0000
   -0.5366
--> N
Error: Undefined function or variable N
--> B
ans =
 Columns 1 to 11
         0    0.8415    0.9093    0.1411   -0.7568   -0.9589   -0.2794    0.6570    0.9894    0.4121   -0.5440
 Columns 12 to 13
   -1.0000   -0.5366
--> b=B'
b =
         0
    0.8415
    0.9093
    0.1411
   -0.7568
   -0.9589
   -0.2794
    0.6570
    0.9894
    0.4121
   -0.5440
   -1.0000
   -0.5366
--> B=b
B =
         0
    0.8415
    0.9093
    0.1411
   -0.7568
   -0.9589
   -0.2794
    0.6570
    0.9894
    0.4121
   -0.5440
   -1.0000
   -0.5366
--> x=0:pi/10:2*pi
x =
 Columns 1 to 11
         0    0.3142    0.6283    0.9425    1.2566    1.5708    1.8850    2.1991    2.5133    2.8274    3.1416
 Columns 12 to 21
    3.4558    3.7699    4.0841    4.3982    4.7124    5.0266    5.3407    5.6549    5.9690    6.2832
--> y=sin(x)
y =
 Columns 1 to 11
         0    0.3090    0.5878    0.8090    0.9511    1.0000    0.9511    0.8090    0.5878    0.3090   -0.0000
 Columns 12 to 21
   -0.3090   -0.5878   -0.8090   -0.9511   -1.0000   -0.9511   -0.8090   -0.5878   -0.3090    0.0000
--> z=cos(x)
z =
 Columns 1 to 11
    1.0000    0.9511    0.8090    0.5878    0.3090   -0.0000   -0.3090   -0.5878   -0.8090   -0.9511   -1.0000
 Columns 12 to 21
   -0.9511   -0.8090   -0.5878   -0.3090    0.0000    0.3090    0.5878    0.8090    0.9511    1.0000
--> g=exp(x)
g =
 Columns 1 to 11
    1.0000    1.3691    1.8745    2.5663    3.5136    4.8105    6.5861    9.0171   12.3454   16.9021   23.1409
 Columns 12 to 21
   31.6824   43.3766   59.3873   81.3076  111.3190  152.4078  208.6629  285.6822  391.1300  535.4995
--> h=log10(x)
h =
 Columns 1 to 11
 -Inf   -0.5028   -0.2018   -0.0257    0.0992    0.1961    0.2753    0.3422    0.4002    0.4514    0.4972
 Columns 12 to 21
    0.5385    0.5763    0.6111    0.6433    0.6732    0.7013    0.7276    0.7524    0.7759    0.7982
--> x=
Error: Unexpected input

     x=
      ^
--> x
ans =
 Columns 1 to 11
         0    0.3142    0.6283    0.9425    1.2566    1.5708    1.8850    2.1991    2.5133    2.8274    3.1416
 Columns 12 to 21
    3.4558    3.7699    4.0841    4.3982    4.7124    5.0266    5.3407    5.6549    5.9690    6.2832
--> BB=cos(x)-sin(x)
BB =
 Columns 1 to 11
    1.0000    0.6420    0.2212   -0.2212   -0.6420   -1.0000   -1.2601   -1.3968   -1.3968   -1.2601   -1.0000
 Columns 12 to 21
   -0.6420   -0.2212    0.2212    0.6421    1.0000    1.2601    1.3968    1.3968    1.2601    1.0000
--> CC=cos(x)*sin(x)
Error: Requested matrix multiplication requires arguments to be conformant.
--> CC
Error: Undefined function or variable CC
--> DD=cos(x).*sin(x)
DD =
 Columns 1 to 11
         0    0.2939    0.4755    0.4755    0.2939   -0.0000   -0.2939   -0.4755   -0.4755   -0.2939    0.0000
 Columns 12 to 21
    0.2939    0.4755    0.4755    0.2939   -0.0000   -0.2939   -0.4755   -0.4755   -0.2939    0.0000
--> A=[1,2,3;4,5,6;7,8,9]
A =
 1 2 3
 4 5 6
 7 8 9
--> A
ans =
 1 2 3
 4 5 6
 7 8 9
--> A(1,1)
ans =
 1
--> A(:,1)
ans =
 1
 4
 7
--> A(1,:)
ans =
 1 2 3
--> A(1:2,2:3)
ans =
 2 3
 5 6
--> B=A(:,1)
B =
 1
 4
 7
--> C=A(1,:)
C =
 1 2 3
--> C=3A(1,:)
Error: Unexpected input

     C=3A(1,:)
        ^
--> C=3*A(1,:)
C =
 3 6 9
--> D=A(1:2,2:3)
D =
 2 3
 5 6
--> degree=0:2*pi/100:2*pi
degree =
 Columns 1 to 11
         0    0.0628    0.1257    0.1885    0.2513    0.3142    0.3770    0.4398    0.5027    0.5655    0.6283
 Columns 12 to 22
    0.6912    0.7540    0.8168    0.8796    0.9425    1.0053    1.0681    1.1310    1.1938    1.2566    1.3195
 Columns 23 to 33
    1.3823    1.4451    1.5080    1.5708    1.6336    1.6965    1.7593    1.8221    1.8850    1.9478    2.0106
 Columns 34 to 44
    2.0735    2.1363    2.1991    2.2620    2.3248    2.3876    2.4504    2.5133    2.5761    2.6389    2.7018
 Columns 45 to 55
    2.7646    2.8274    2.8903    2.9531    3.0159    3.0788    3.1416    3.2044    3.2673    3.3301    3.3929
 Columns 56 to 66
    3.4558    3.5186    3.5814    3.6443    3.7071    3.7699    3.8328    3.8956    3.9584    4.0212    4.0841
 Columns 67 to 77
    4.1469    4.2097    4.2726    4.3354    4.3982    4.4611    4.5239    4.5867    4.6496    4.7124    4.7752
 Columns 78 to 88
    4.8381    4.9009    4.9637    5.0266    5.0894    5.1522    5.2151    5.2779    5.3407    5.4036    5.4664
 Columns 89 to 99
    5.5292    5.5920    5.6549    5.7177    5.7805    5.8434    5.9062    5.9690    6.0319    6.0947    6.1575
 Columns 100 to 101
    6.2204    6.2832
--> output=sin(degree)
output =
 Columns 1 to 11
         0    0.0628    0.1253    0.1874    0.2487    0.3090    0.3681    0.4258    0.4818    0.5358    0.5878
 Columns 12 to 22
    0.6374    0.6845    0.7290    0.7705    0.8090    0.8443    0.8763    0.9048    0.9298    0.9511    0.9686
 Columns 23 to 33
    0.9823    0.9921    0.9980    1.0000    0.9980    0.9921    0.9823    0.9686    0.9511    0.9298    0.9048
 Columns 34 to 44
    0.8763    0.8443    0.8090    0.7705    0.7290    0.6845    0.6374    0.5878    0.5358    0.4817    0.4258
 Columns 45 to 55
    0.3681    0.3090    0.2487    0.1874    0.1253    0.0628   -0.0000   -0.0628   -0.1253   -0.1874   -0.2487
 Columns 56 to 66
   -0.3090   -0.3681   -0.4258   -0.4818   -0.5358   -0.5878   -0.6374   -0.6846   -0.7290   -0.7705   -0.8090
 Columns 67 to 77
   -0.8443   -0.8763   -0.9048   -0.9298   -0.9511   -0.9686   -0.9823   -0.9921   -0.9980   -1.0000   -0.9980
 Columns 78 to 88
   -0.9921   -0.9823   -0.9686   -0.9511   -0.9298   -0.9048   -0.8763   -0.8443   -0.8090   -0.7705   -0.7290
 Columns 89 to 99
   -0.6845   -0.6374   -0.5878   -0.5358   -0.4817   -0.4258   -0.3681   -0.3090   -0.2487   -0.1874   -0.1253
 Columns 100 to 101
   -0.0628    0.0000
--> plot(degree,output)
--> hold
--> hold off
--> plot(degree,output)
--> plot(degree,cos(degree))
--> plot(degree,output)
--> hold
--> plot(degree,cos(degree))
--> 1+3
ans =
 4
--> hold
--> 3+4
ans =
 7
--> plot(degree,output)
--> hold off
--> plot(degree,output)
--> hold
--> plot(degree,cos(degree))
--> 3+3
--> plot(degree,output)
--> plot(degree,cos(degree))
--> cosoutput=cos(degree)
cosoutput =
 Columns 1 to 11
    1.0000    0.9980    0.9921    0.9823    0.9686    0.9511    0.9298    0.9048    0.8763    0.8443    0.8090
 Columns 12 to 22
    0.7705    0.7290    0.6845    0.6374    0.5878    0.5358    0.4818    0.4258    0.3681    0.3090    0.2487
 Columns 23 to 33
    0.1874    0.1253    0.0628   -0.0000   -0.0628   -0.1253   -0.1874   -0.2487   -0.3090   -0.3681   -0.4258
 Columns 34 to 44
   -0.4818   -0.5358   -0.5878   -0.6374   -0.6846   -0.7290   -0.7705   -0.8090   -0.8443   -0.8763   -0.9048
 Columns 45 to 55
   -0.9298   -0.9511   -0.9686   -0.9823   -0.9921   -0.9980   -1.0000   -0.9980   -0.9921   -0.9823   -0.9686
 Columns 56 to 66
   -0.9511   -0.9298   -0.9048   -0.8763   -0.8443   -0.8090   -0.7705   -0.7290   -0.6845   -0.6374   -0.5878
 Columns 67 to 77
   -0.5358   -0.4817   -0.4258   -0.3681   -0.3090   -0.2487   -0.1874   -0.1253   -0.0628    0.0000    0.0628
 Columns 78 to 88
    0.1253    0.1874    0.2487    0.3090    0.3681    0.4258    0.4818    0.5358    0.5878    0.6374    0.6846
 Columns 89 to 99
    0.7290    0.7705    0.8090    0.8443    0.8763    0.9048    0.9298    0.9511    0.9686    0.9823    0.9921
 Columns 100 to 101
    0.9980    1.0000
--> plot(degree,output)
--> hold
--> plot(degree,cosoutput)
--> hold off
--> plot(degree,output,degree,cosoutput)
--> a=2
a =
 2
--> square
Error: Undefined function or variable square
--> source 'C:/Users/ShengQuan/Desktop/square.m'
squared =
 4
squareroot =
    1.4142
--> a=2
a =
 2
--> square
Error: Undefined function or variable square
--> square
Error: Undefined function or variable square
--> source 'C:/Users/ShengQuan/Desktop/square.m'
squared =
 4
squareroot =
    1.4142
--> source 'C:/Users/ShengQuan/Desktop/square.m'
squared =
 4
squareroot =
    1.4142
--> a=1-
Error: Unexpected input

     a=1-
      ^
--> source 'C:/Users/ShengQuan/Desktop/square.m'
squared =
 4
squareroot =
    1.4142
--> a=10
a =
 10
--> source 'C:/Users/ShengQuan/Desktop/square.m'
squared =
 100
squareroot =
    3.1623
--> source 'C:/Users/ShengQuan/Desktop/square.m'r
Error: source function takes exactly one argument - the filename of the script to execute
--> source 'C:/Users/ShengQuan/Desktop/square.m'r
Error: source function takes exactly one argument - the filename of the script to execute
--> source 'C:/Users/ShengQuan/Desktop/square.m'
squared =
 100
squareroot =
    3.1623
--> R=[50,40;40,60]
R =
 50 40
 40 60
--> V=[10;20]
V =
 10
 20
--> I=inv(R)*V
I =
   -0.1429
    0.4286
--> A=[30,-10;-10,15]
A =
  30 -10
 -10  15
--> C=[15;7]
C =
 15
  7
--> B=inv(A)*C
B =
    0.8429
    1.0286
--> B(1)-B(2)
ans =
   -0.1857
-->

Tuesday, March 28, 2017

Thevenin's Theorem


At first, we used schematic to calculate V_th and R_th. V_th=0.4579V and R_th=7.7k-ohm


We set it up(1)
We set it up(2)

We got R_th of 7.4k-ohm
and got V_th of 0.46V
We selected 4.8l-ohm resistor as our load-resistor and got 0.75V across it.(However, our estimated V_th was 0.4579V)
Our measured values.
We collected some Voltage and Resistance data and used P=(V^2)/R to get their power and plotted against Voltage. (Graph seems wrong)
Summary: In this lab, we first calculated R_th and V_th of the circuit. and then we choose a resistor bigger than 4k-ohm and smaller than 10k-ohm(we used 4.8k-ohm) to measure its actual Voltage across its terminals, which were very different than V_th we calculated. And at last, we used Potentiometer to vary our resistance and gather some data of Voltage at different resistance and used it and equation P=(V^2)/R to plot Voltage vs. Power graph and tried to find a resistor that gives us maximum power at across terminals. However, we made mistakes and our graph looks very wrong.

Superposition (2)


At First, we calculated Voltage across 6.8k-ohm resistor caused by both 3V and 5V source. We calculated 0.7081V caused by 3V source and 2.01V by 5V source.(We are missing calculation done on 5V source.)

The Setup.


We measured Voltage across 6.8k-ohm resistor with both voltage source to be 2.69V


We measured Voltage across 6.8k-ohm resistor by 3V source is 0.69V.

We measured Voltage across 6.8k-ohm resistor to be 1.98V

We made table of measured and expected Voltage, and calculated the %of difference.
Summary: This lab was straight forward. Use Superposition to figure out Voltage across the 6.8k-ohm resistor due by both 3V and 5V sources separately and then combine it later to obtain total voltage. We first used this technique to calculate voltage across 6.8k-ohm resistor to be 0.71V and 2.01V by 3V and 5V source, respectively. After that, we set up and built circuit and measured the voltage due to 3V and 5V sources separately(we short-circuited the voltage source we are not using) and got 0.69V and 1.98V respectively. The voltages calculated and measured are approximately same with little %
of difference. It is safe to say it is caused by differences in actual resistance in resistor and labeled resistance. Thus the Superposition is very accurate way to calculate unknowns in circuit

Thursday, March 23, 2017

Mesh Analysis 2

Today we did Mesh Analysis two.

We calculated the values of what we are going to measure.(V_6.8k=5V, V_10k=3.22V, and Current through the 10k-ohm as 3.22*10^-4 A)
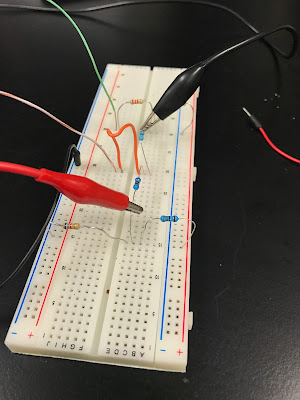
We set it up.
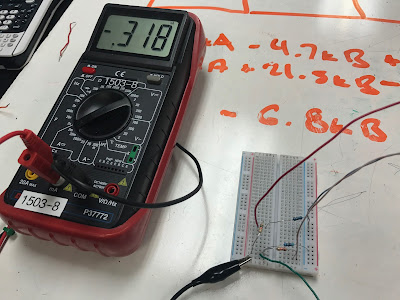
We measured 3.18 V(measured in opposite direction) across 10k-ohm resistor.

And 4.96V across the 6.8k-ohm resistor.

After this lab we did exercises on how to detect and generate different types of current and voltage.

We used 10K-ohm resistor to measure voltage across it.

We generated sin wave and able to detect it.

Additionally, we did some other mesh problems.

Summary: In this lab, we calculated our voltages values we will me measuring at specific resistor using mesh method; we set it up and able to measure values very close to our calculation; The difference could be the difference in actual resistance and labeled resistance. We were also able to generate different kind of waves(current, voltage) and opened scope function to detect it. And at last, we did some other mesh problems.


Friday, March 17, 2017

Nodal Analysis


1st problem we did in the class.(we did not finish it)

The Lab
We calculated the voltage we will be measuring at V1 and V2. (They are 2.424V and 4.424V respectly)


This is our setup

We measured 2.43V across V1

And we measured 4.39V across V2


Summary: If we calculate voltage of V1 and V2 with actual resistance, we get V1=2.442V and V2=4.442V which is very similar to what we calculated with theoretical resistance. All of the calculated voltages are not too far from measured voltages which conclude Nodal analysis is actually very good calculation/estimation.

Friday, March 10, 2017

Temperature measurement system

In this lab, we are going to make a device to detect different voltage for different temperature. Goal of this lab is to detect minimum of 0.5 V over a temperature range of 25C to 37C.
We calculated that we need a resistor that is between 4338 ohm to 17800 ohm to have 0.5 V different between 25C and 37C.
We chose 10K ohm resistor as our resistor.


We calculated the voltages we will measure from those temperatures. That is 2.381V and 2.941 V
Setup (1)
Setup (2)

Expected(Calculated)
Result
Percent difference (%)
Desired fixed resistor
10k ohm
9.84k ohm
1.6
Voltage (hot)
2.941V
2.93V
0.37
Voltage (cold)
2.381V
2.4V
0.798
Voltage difference
0.56V
0.53V
5.36
Thermistor resistance at 25 C0

10.5k ohm

Thermistor resistance at 37 C0

7k ohm


Summary: We have achieved the minimum of 0.5V difference in this design. From varying of many parts we got different number as our calculation, however, percentage of difference was not too much. This kind of design can be used at place you want to monitor temperature and initiate the procedures at desired temperature. For example, when interior of computer system is too hot, it can be shut down, or when temperature of refrigerator is too high, it can start refrigerating.

Dusk-to-Dawn Light

We calculated the Voltage across Photocell V_b to be 1.7V for 5k(ohm) and 3.33V for 20k(ohm)
The setup.
When the Light sensor was exposed to light the V_b which is voltage across the photocell was .91V and V_d which is voltage across the LED light was 0.54.

After we covered the sensor, the V_b was 2.45V and V_d was 1.93V.

Summary: In this lab we created some device that lights up in dark and turns off at light. The photocell has high resistance when there is low light and low resistance when there is low light, and BJT (Bipolar Junction Transistors) is VCCS (Voltage controlled current source). That is why photocell provides high voltage to base of BJT in low light and low voltage or not enough voltage in bright light. This is why it turns off in bright light and turns on when we covered the photocell.

Friday, March 3, 2017

Dependent Sources and MOSFETs

1. Set up.
2. Set up.
3. Set up.

4. Set up.
Data collected
Data


Summary: In this lab, we measured Gate- to source voltage a MOSFET(metal–oxide–semiconductor field-effect transistor) needed to conduct current. We looked for the threshold voltage and how drain current is changing depend on changing in voltage. The MOSFET started transmitting current when Voltage hit 0.5 volt, so it is threshold voltage. Looking at the graph, from 0.6 volt to maximum current 0.8 volt, the graph is concave upward for first half and downward for last half. As we have learned, This is VCCS(a voltage-controlled current source) because it controls current with voltage. Using data, we came up with best-fit line/regression line and its equation is y=220.29x-140.15. As the lab manual have said, "The parameter g of a VCCS provides a relationship between the rate of change between the applied voltage and the resulting current. This is essentially the slope of the data you plotted in part 3 above", therefore, the g is 220.29 and maybe unit of mA per Volt. At the end of this make-up lab, I asked Prof. Mason if our data was right, but it was wrong. It is just like life, you did something wrong you thought you did it right. (tragic)

Thursday, March 2, 2017

Resistors and Ohms Law - Voltage-Current Characteristics

Setting ups for measuring Voltage and Current.


Data we have acquired. (3V is at last)
Table and graph. (Equation of the regression line is y=0.0105x-0.0021)
Summary: The Voltage and resistance across resistor change with changing in Voltage source. Unlike ideal condition V=IR. However, it does not varies significantly. This happends because there are no or little such thing as ideal voltage source. Voltage across poles changes with respect to resistors. (I think so) 

Additionally, we did some other problems, like this one. (We gave Voltage sources polarities and got our current and used it solve for voltage across point A to B.)


Wednesday, March 1, 2017

Solderless Breadboards, Open-circuits and Short-circuits.

1. Same row same side. (very low resistance.)
2. Same row opposite side.( Infinity resistance.)

3. Different row opposite side. (Infinity resistance.)

4. Different row opposite side connected with jumper wire. (very low resistance.)

Last Problem we did (The answer was 20V)
The result is that 1, short circuit  2, open circuit 3, open circuit   4, short circuits.